Disney World crowd report: Oct. 5–11, 2026
Crowd Report3 min read
Standby's Disney World crowd report for Oct. 5–11: Hollywood Studios led the week, plus the biggest ride movers and Magic Kingdom's party-night hours.
Average standby wait, all 4 parks
27min
Wed 7
Lightest day
Hollywood Studios
Busiest park
Park by park
Hollywood Studios rose the most (▲29%)
Hollywood Studios
36 minup29%EPCOT
28 minup8%Animal Kingdom
24 minup26%Magic Kingdom
19 minup19%
| The week before | Oct 5 – 11 | |
|---|---|---|
| Hollywood Studios | 28 | 36 |
| EPCOT | 26 | 28 |
| Animal Kingdom | 19 | 24 |
| Magic Kingdom | 16 | 19 |
Day by day
Wed 7 was the lightest day
| Park | Mon5 | Tue6 | Wed7 | Thu8 | Fri9 | Sat10 | Sun11 |
|---|---|---|---|---|---|---|---|
| MKMagic Kingdom | 24 | 12 | 19 | 13 | 17 | 23 | 24 |
| EPEPCOT | 25 | 24 | 19 | 26 | 35 | 33 | 33 |
| HSHollywood Studios | 30 | 30 | 25 | 36 | 46 | 43 | 45 |
| AKAnimal Kingdom | 22 | 18 | 14 | 18 | 32 | 32 | 29 |
Hollywood Studios through the day
Waits peaked at 48 min around noon
| Oct 5 – 11 | The week before | |
|---|---|---|
| 8 a.m. | 23 | 17 |
| 9 a.m. | 32 | 25 |
| 10 a.m. | 41 | 31 |
| 11 a.m. | 47 | 34 |
| noon | 48 | 35 |
| 1 p.m. | 44 | 31 |
| 2 p.m. | 46 | 32 |
| 3 p.m. | 43 | 28 |
| 4 p.m. | 39 | 28 |
| 5 p.m. | 37 | 29 |
| 6 p.m. | 36 | 30 |
| 7 p.m. | 31 | 29 |
| 8 p.m. | 25 | 23 |
| 9 p.m. | 15 | 17 |
Biggest movers
Rides whose average wait changed the most
Avatar Flight of Passage
Animal Kingdom
67 minup22 minSlinky Dog Dash
Hollywood Studios
70 minup20 minTest Track
EPCOT
76 minup17 minStar Wars: Rise of the Resistance
Hollywood Studios
52 minup12 minTRON Lightcycle / Run
Magic Kingdom
57 minup12 min
| The week before | Oct 5 – 11 | |
|---|---|---|
| Avatar Flight of Passage (Animal Kingdom) | 45 | 67 |
| Slinky Dog Dash (Hollywood Studios) | 50 | 70 |
| Test Track (EPCOT) | 59 | 76 |
| Star Wars: Rise of the Resistance (Hollywood Studios) | 40 | 52 |
| TRON Lightcycle / Run (Magic Kingdom) | 45 | 57 |
Magic Kingdom hours, Oct 12 – 18
Not-So-Scary Party on 4 nights · open late 2 nights
Mon 12
9a–10p
Tue 13
8a–6p
Not-So-Scary Party
Wed 14
8a–11p
Open late
Thu 15
8a–6p
Not-So-Scary Party
Fri 16
8a–6p
Not-So-Scary Party
Sat 17
8a–11p
Open late
Sun 18
8a–6p
Not-So-Scary Party
Read the full report
The week at a glance
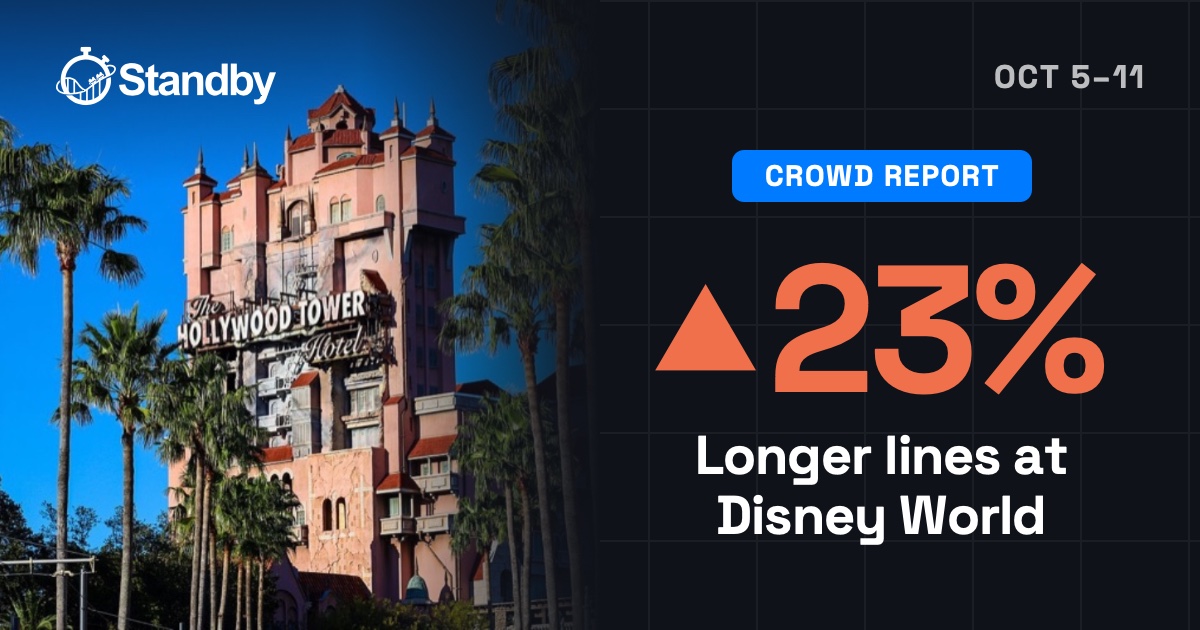
Standby's wait-time tracking put the average standby wait across Disney World's four theme parks at 27 minutes for Oct. 5–11. The week before, the figure was 22 minutes, so waits ran 23% longer. Every park moved in the same direction, but not by the same amount.
Park by park
Hollywood Studios was the busiest park and the biggest jump: a 36-minute average, up 29% from 28. By hour, Standby's tracking showed waits averaging 23 minutes at 8 a.m., climbing to 48 at noon and easing to 15 by 9 p.m. The noon hour averaged 35 minutes the week before.
Animal Kingdom averaged 24 minutes, up 26% from 19. Magic Kingdom averaged 19, up 19% from 16. EPCOT averaged 28, up 8% from 26, the smallest increase of the four.
Best and busiest days
Wednesday, Oct. 7 was the best day across the four parks. Standby's tracking had Magic Kingdom at 19 that day, EPCOT at 19, Animal Kingdom at 14 and Hollywood Studios at 25.
The weekend was a different story at Hollywood Studios, which was the only park rated high, with averages of 46 minutes on Friday, Oct. 9, 43 on Saturday and 45 on Sunday. EPCOT's busiest day was Friday at 35. Animal Kingdom averaged 32 on both Friday and Saturday.
The biggest movers
Avatar Flight of Passage at Animal Kingdom saw the largest change: a 67-minute average against 45 the week before, a 22-minute increase. Slinky Dog Dash at Hollywood Studios averaged 70 minutes, up from 50. Test Track at EPCOT averaged 76, up from 59. Star Wars: Rise of the Resistance averaged 52, up from 40, and TRON Lightcycle / Run at Magic Kingdom averaged 57, up from 45.
The tracking shows how much waits moved, not why, so there is no explanation attached to any of these ride changes.
Hours to know for Oct. 12–18
The parks' published schedule shows unusual Magic Kingdom hours next week. Normal closing is 10 p.m., and that is the schedule on Monday, Oct. 12, when the park opens at 9 a.m. after early entry starting at 8:30 a.m.
On Oct. 13, 15, 16 and 18, the park closes at 6 p.m. for Mickey's Not-So-Scary Halloween Party, which runs 7 p.m. to midnight. Those days open at 8 a.m., with early entry starting at 7:30 a.m. On Wednesday, Oct. 14 and Saturday, Oct. 17, the park stays open until 11 p.m. In all, six of the week's seven days have a flagged schedule.
What it means for a visit
If you want the shortest lines of the week just measured, midweek was the answer: Wednesday, Oct. 7 beat everything else. If Hollywood Studios is on your list, Friday through Sunday was where the high ratings landed, and the hourly pattern shows the morning averaging far shorter waits than the midday stretch.
For Magic Kingdom, the schedule matters more than any average. On party days, plan to finish by 6 p.m. unless you are attending the party. On Oct. 14 and 17, you get an extra hour compared with a normal 10 p.m. close.
These figures describe the week that ended Oct. 11. They are not a forecast for the week ahead, and the published hours can change.
 By the Standby team